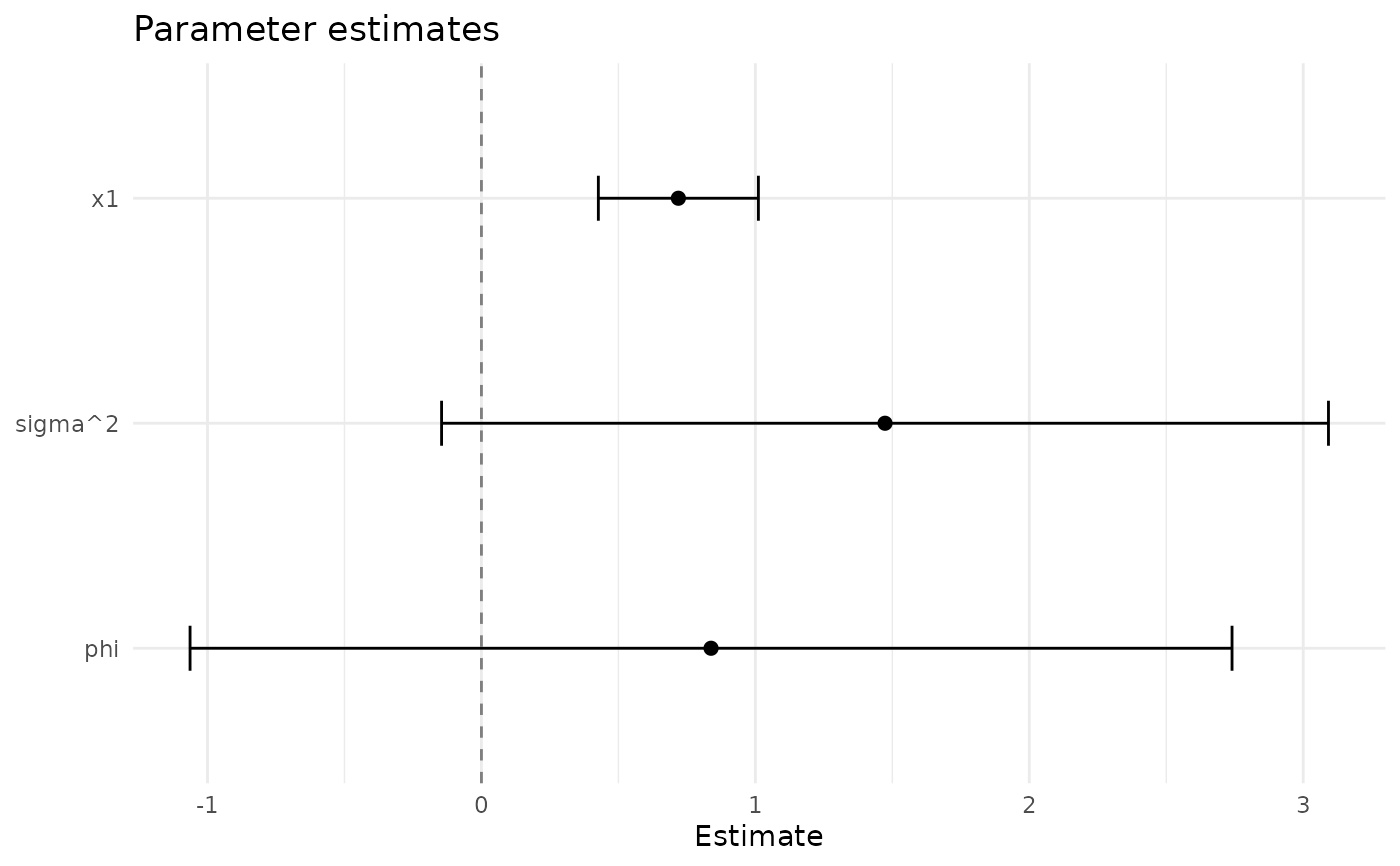
Coefficient plot of fixed effects (and sigma^2) with confidence intervals
Source:R/viz.R
coef_plot.RdCoefficient plot of fixed effects (and sigma^2) with confidence intervals
Examples
# \donttest{
data(sdalgcp_data)
fit <- sdalgcp(cases ~ x1 + offset(log(pop)), data = sdalgcp_data,
               control = sdalgcp_control(n_sim = 2000, burnin = 500, thin = 5,
                                         reanchor = 0))
coef_plot(fit)
#> `height` was translated to `width`.

# }
# }