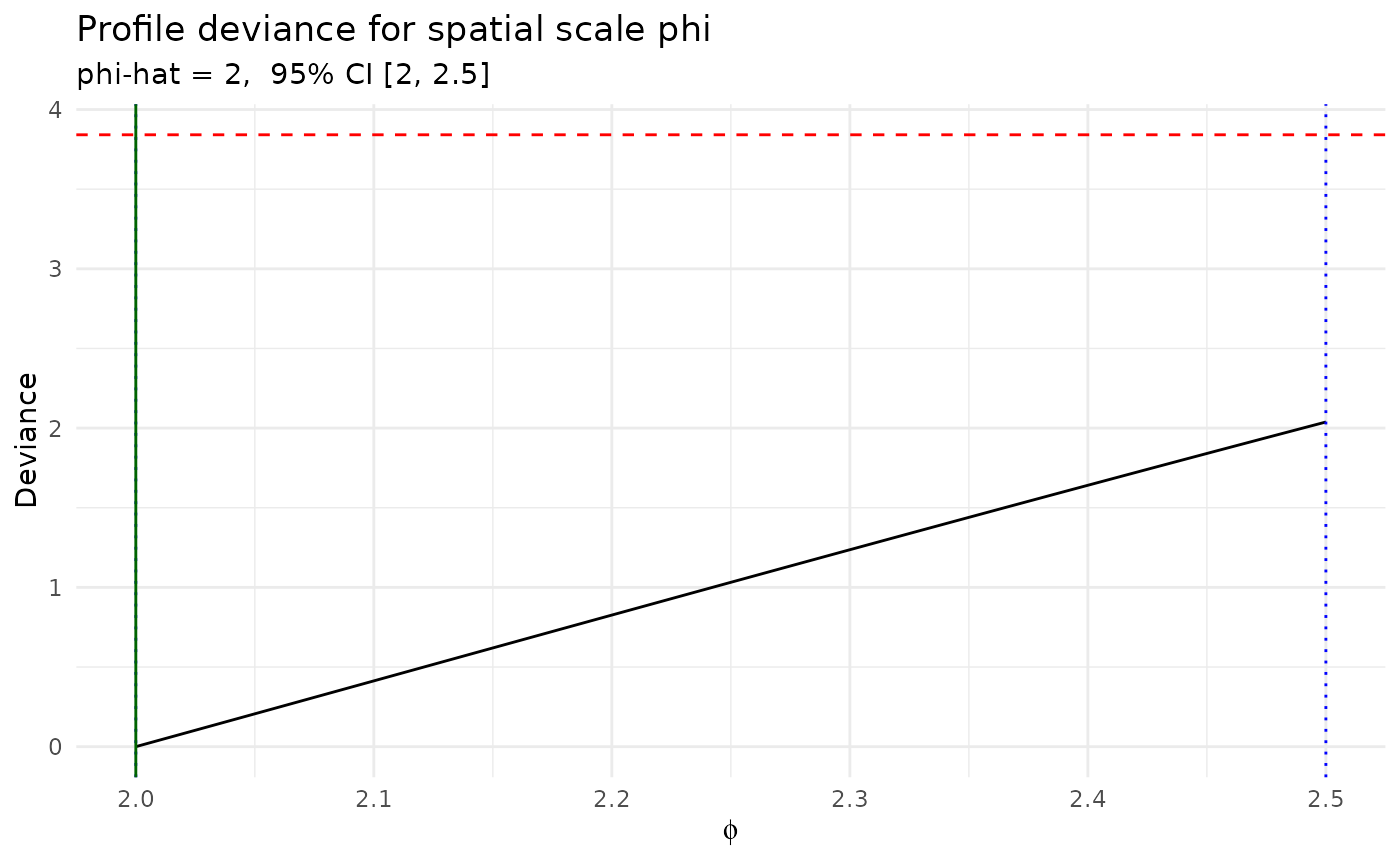
Spline-smoothed profile deviance for phi, with the
coverage-level confidence interval where the deviance crosses the
chi-squared cutoff.
Value
invisibly, a list with the interval and the smoothed profile; a
ggplot is drawn when plot = TRUE.
Examples
# \donttest{
data(sdalgcp_data)
## profile phi on a grid (scale = "grid") so there is a deviance curve to draw
fit <- sdalgcp(cases ~ x1 + offset(log(pop)), data = sdalgcp_data,
               control = sdalgcp_control(scale = "grid", n_sim = 2000,
                                         burnin = 500, thin = 5, reanchor = 0))
phi_profile(fit)

# }
# }