A real aggregated disease-count dataset: incident primary biliary cirrhosis
(a chronic liver disease) cases by Lower-layer Super Output Area (LSOA) in the
Newcastle and Gateshead area of North East England, with population and area
deprivation covariates. This is the case study of Johnson et al. (2019) and a
realistic test bed for the spatial model: cases ~ deprivation +
offset(log(pop)).
Format
An sf object of 545 LSOA polygons
(British National Grid, EPSG:27700) with columns:
- lsoa
LSOA 2004 census code.
- cases
observed incident case count in the LSOA.
- pop
population at risk (the offset; use
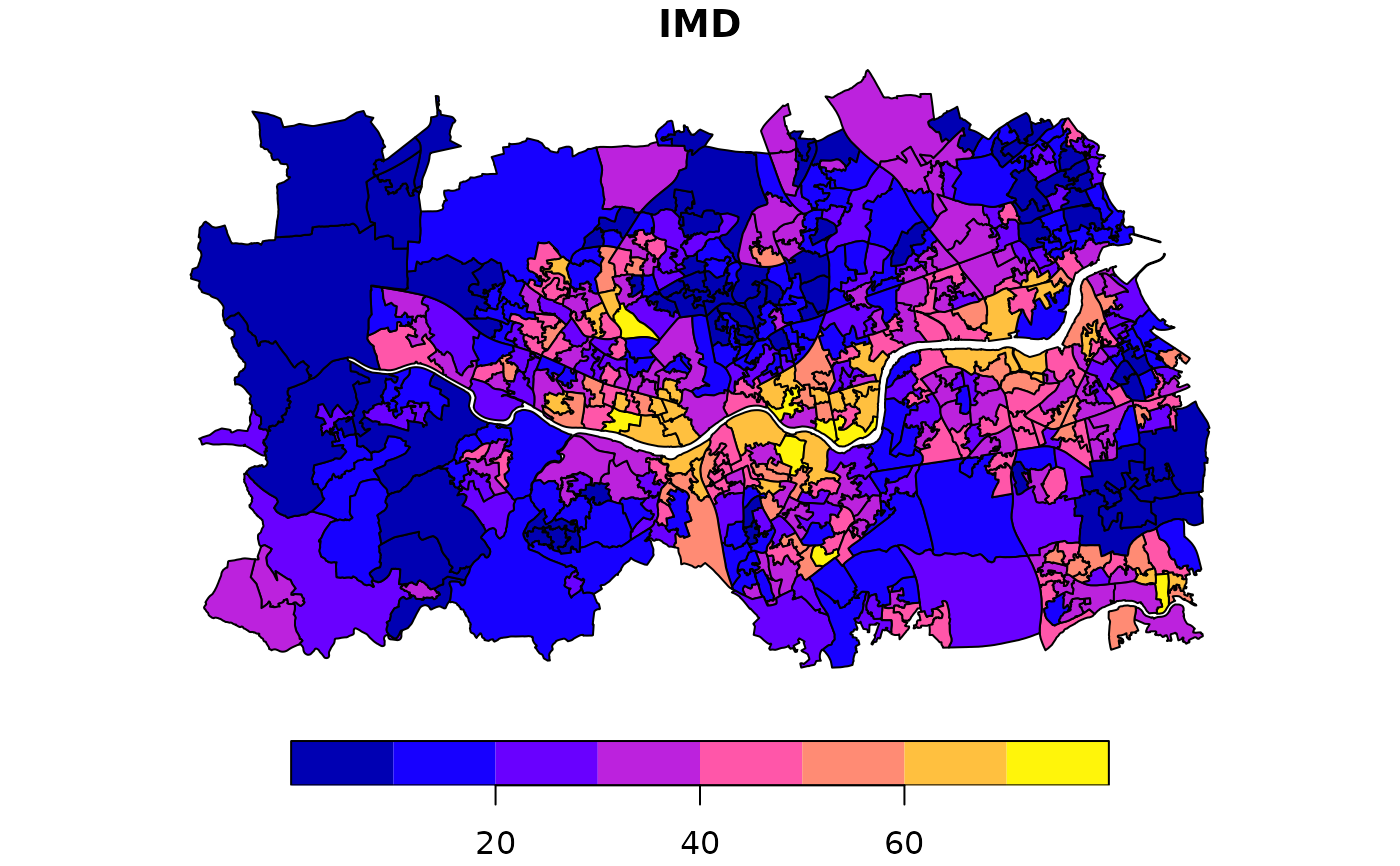
offset(log(pop))).- IMD
Index of Multiple Deprivation score (higher = more deprived).
- Income
income-deprivation score.
- Employment
employment-deprivation score.
- geometry
the LSOA polygon.
Source
Johnson, O., Diggle, P. and Giorgi, E. (2019), "A spatially discrete
approximation to log-Gaussian Cox processes for modelling aggregated disease
count data", Statistics in Medicine, 38(24), 4871-4884.
doi:10.1002/sim.8339
. Population and area-deprivation covariates are from
the 2004 English indices of deprivation (Lower-layer Super Output Area level).
See data-raw/liver.R in the package sources.
See also
sdalgcp_data for a small simulated example.