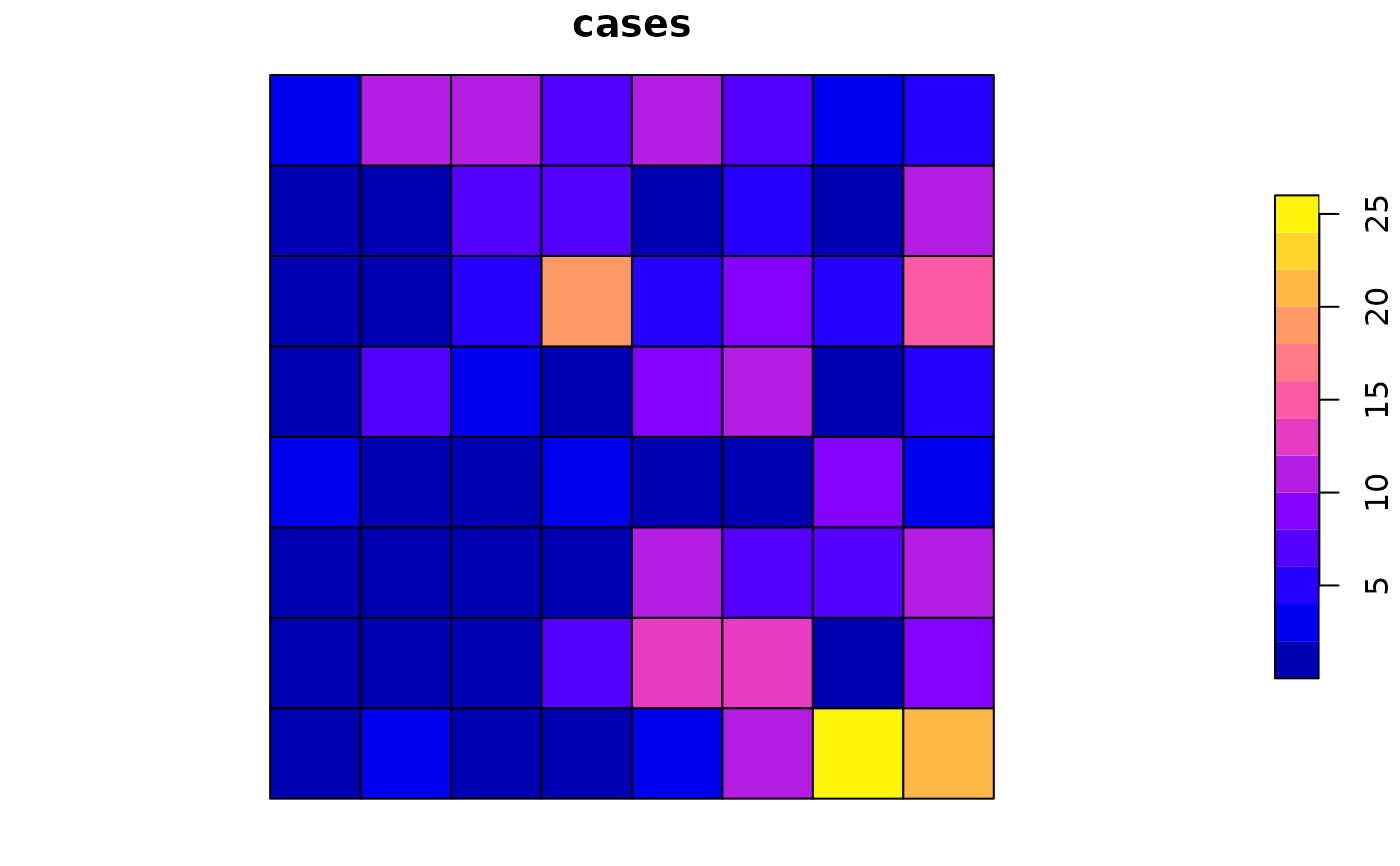
A small, self-contained example dataset used throughout the help pages and
vignettes. It is simulated from the model the package fits: an 8x8 lattice of
regions, a spatially structured covariate, a latent Gaussian spatial field
with exponential covariance, and Poisson counts with a population offset. The
true fixed effects are (Intercept) = -6 and x1 = 0.6; the latent
field has variance \(\sigma^2 = 0.3\) and exponential scale \(\phi = 4\).
Format
An sf object of 64 POLYGON regions with columns:
- region
integer region identifier (1-64).
- cases
observed disease count in the region.
- x1
a standardised, spatially structured covariate.
- pop
population at risk (the offset; use
offset(log(pop))).- geometry
the region polygon.
See also
liver for a real disease-count example.