Maps any of the four predicted quantities from predict.SDALGCP2
– the relative risk "relative_risk", the covariate-adjusted relative
risk "adjusted_rr", or their standard errors
"relative_risk_se"/"adjusted_rr_se" – for either discrete
(choropleth) or continuous (raster) predictions.
Arguments
- x
an object of class
"SDALGCP2_pred".- variable
one of
"relative_risk","adjusted_rr","relative_risk_se","adjusted_rr_se".- bound
optional
sfboundary; continuous surfaces are masked to it and its outline overlaid.- midpoint
optional value to centre a diverging colour scale (defaults to 1 for the relative-risk columns, none for the standard errors).
- title
optional plot title.
- ...
unused.
Examples
# \donttest{
data(sdalgcp_data)
fit <- sdalgcp(cases ~ x1 + offset(log(pop)), data = sdalgcp_data,
control = sdalgcp_control(n_sim = 2000, burnin = 500, thin = 5,
reanchor = 0))
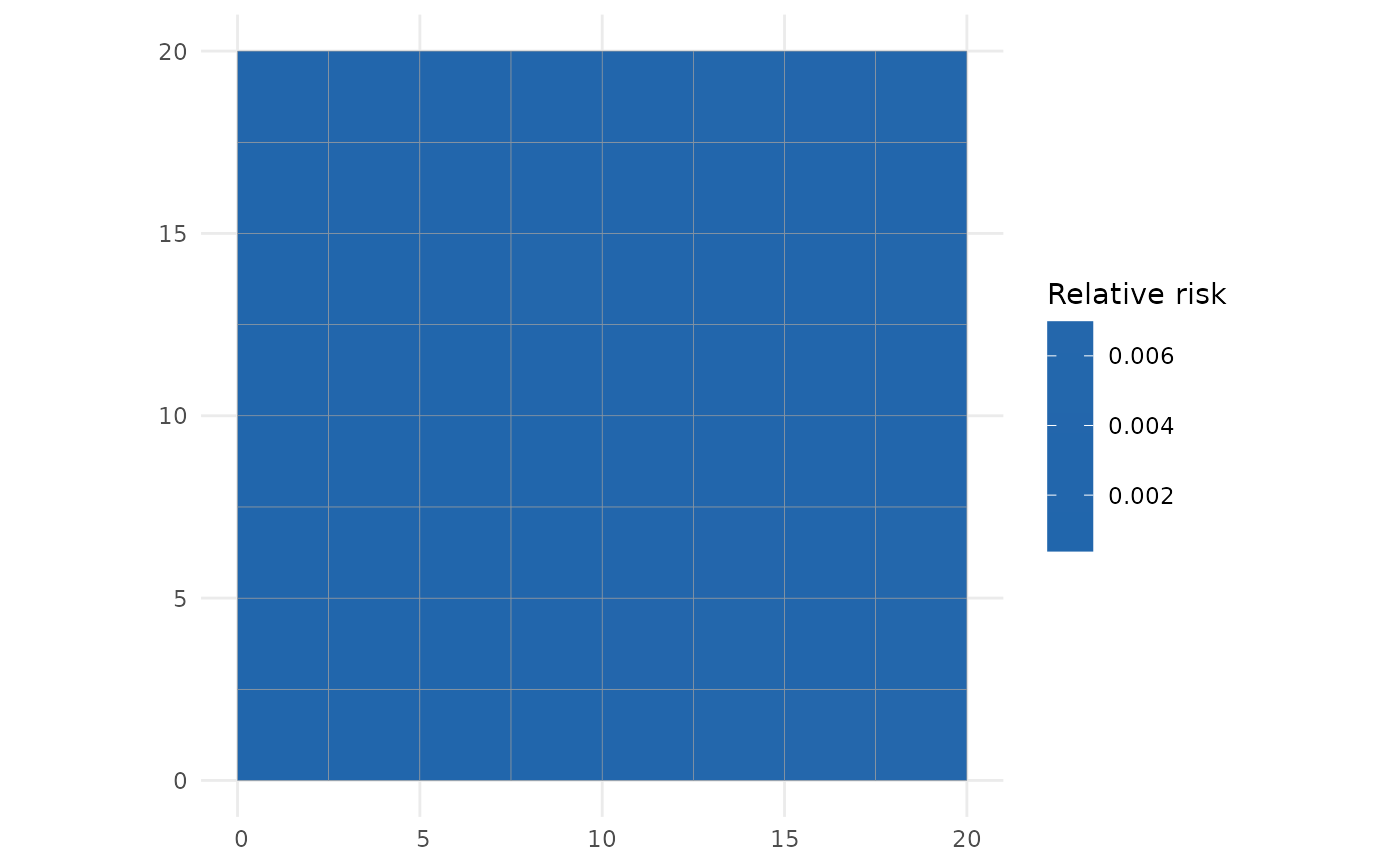
pr <- predict(fit, type = "discrete")
plot(pr, variable = "relative_risk") # choropleth of relative risk
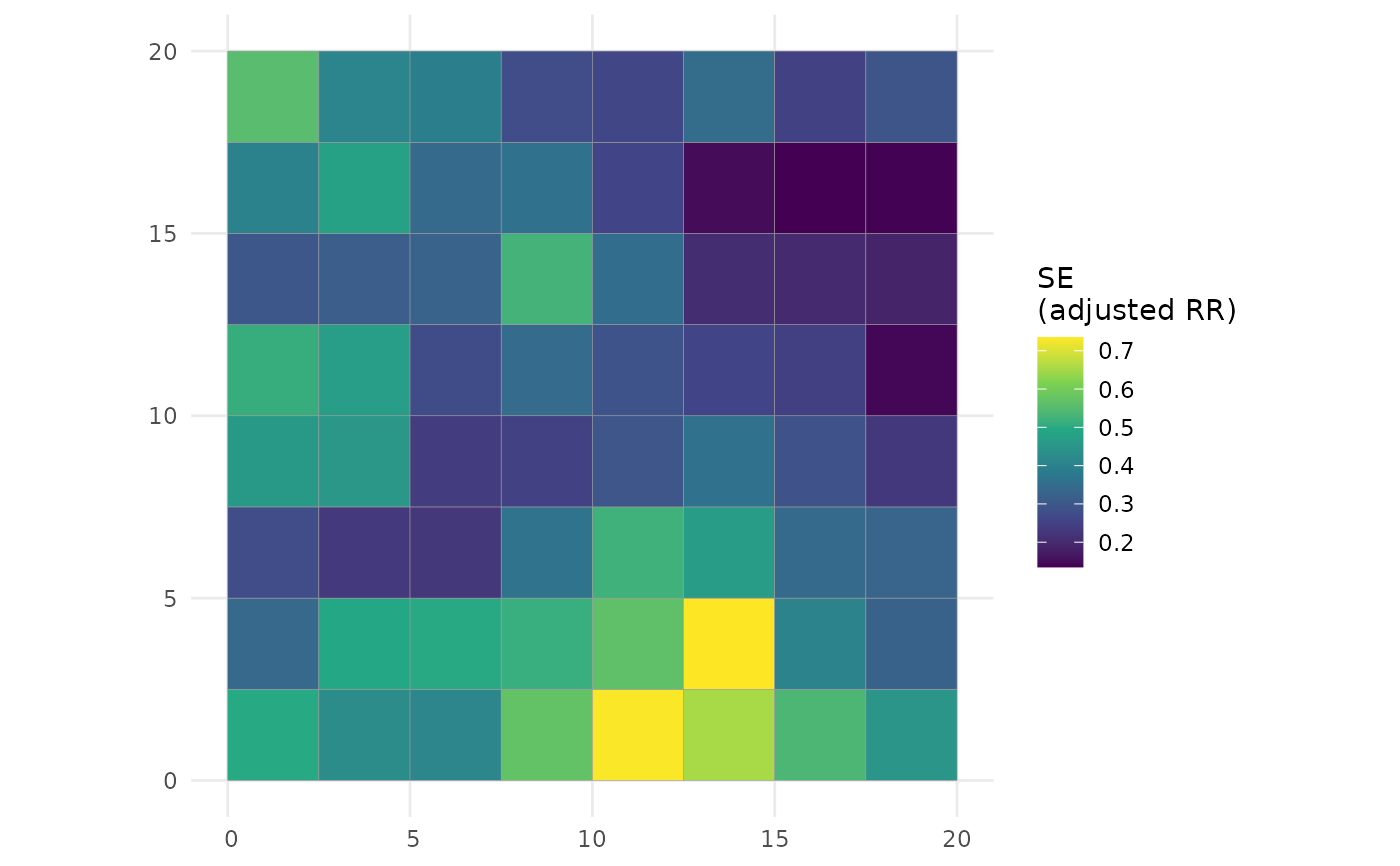
 plot(pr, variable = "adjusted_rr_se") # its uncertainty
 # }
# }