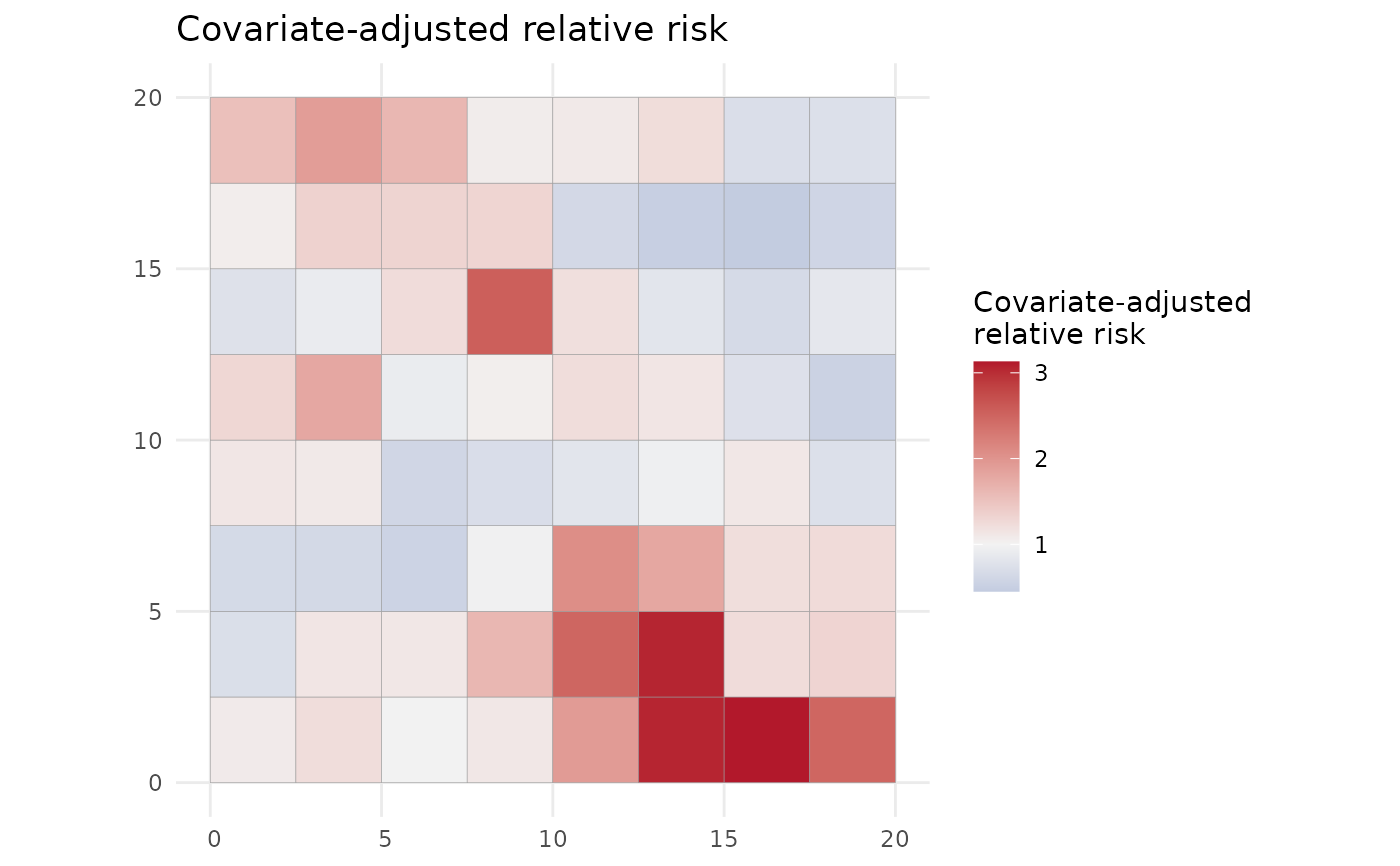
Returns the maps and summaries an analyst usually wants after fitting:
relative-risk and uncertainty maps, an exceedance map, the coefficient plot
and the phi profile. The pieces are returned as a named list of ggplot
objects so they can be arranged or printed individually.
Arguments
- object
a fitted
"SDALGCP2"object.- pred
optional discrete prediction; computed if
NULL.- threshold
relative-risk threshold for the exceedance map.
- ...
passed to
predict.SDALGCP2whenpredis computed.
Examples
# \donttest{
data(sdalgcp_data)
fit <- sdalgcp(cases ~ x1 + offset(log(pop)), data = sdalgcp_data,
               control = sdalgcp_control(n_sim = 2000, burnin = 500, thin = 5,
                                         reanchor = 0))
figs <- report(fit, threshold = 1.5)
names(figs)          # relative_risk, uncertainty, exceedance, coefficients, ...
#> [1] "relative_risk" "uncertainty"   "exceedance"    "coefficients"
#> [5] "phi_profile"
figs$relative_risk   # print one of the maps

# }
# }